
Health monitoring and prognostics
Measuring assets while they operate, and estimating how long they have before they need attention.
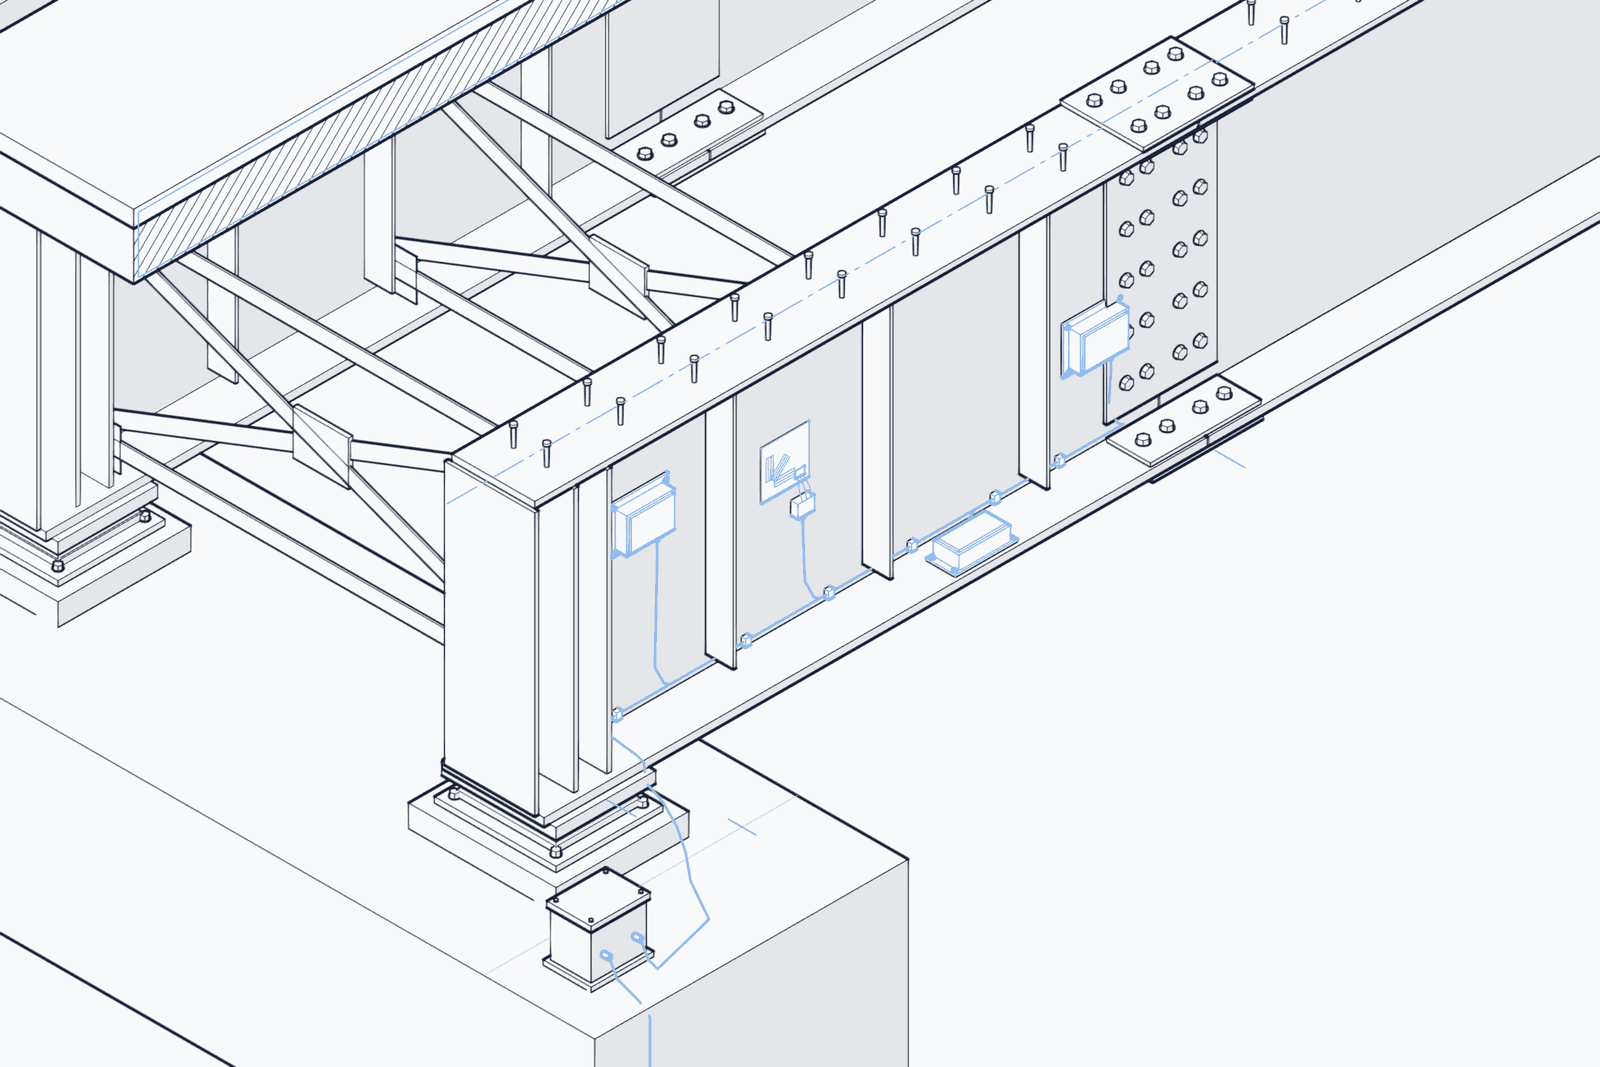
Inspection tells you the condition of an asset on the day you look. Health monitoring tells you how that condition changes between inspections. We instrument components and systems, collect data in service, separate real degradation from noise and operating variation, and estimate remaining useful life with a stated uncertainty. We start by asking which failure modes matter, which signals would show them early, and whether existing sensors and records already hold that evidence. Where they do not, we specify and fit the instrumentation needed. Health monitoring is one of the areas we work in, and a project here can run from a feasibility study to a working prototype system.
Instrumentation and in-service data
Design loads and test-rig results describe an asset under assumed conditions; in service, temperatures, pressures, vibration and duty cycles differ between units, routes and seasons. We choose sensors for the quantity, range and environment, install them so they do not alter the behaviour being measured, and record temperature, pressure and ambient conditions on a common time base so cause and effect can be read across channels. Infrared readings depend on emissivity and viewing geometry, so we characterise surfaces before relying on absolute temperatures. Every channel carries an uncertainty budget, and gaps, drop-outs and suspect values are marked, not silently filled. You receive a measurement plan and sensor specification, calibrated, time-aligned data sets with quality flags, an uncertainty statement per channel, a campaign report and a data pipeline definition. Equipment: instrumentation and data acquisition, infrared cameras and modelling workstations.
Condition monitoring and prognostics
Most components degrade gradually before they fail, but the signal is small, noisy and mixed with normal variation in load and environment. We separate abnormal behaviour from normal operating variation, tie diagnosis to physical failure modes, and estimate remaining life with a confidence interval that updates as data arrives. Physics models describe how a fault grows and data-driven models capture what the physics leaves out; combined, they extrapolate more reliably than either alone. Where few failures have been recorded, we use simulated fault signatures, transfer learning and models trained on healthy behaviour. We assess whether monitoring can safely replace or extend a fixed interval. You receive diagnostic and prognostic models, remaining-life estimates with confidence bounds, alert thresholds and decision rules, a validation report on detection and false alarms, and interval recommendations. Equipment: instrumentation, data acquisition and modelling workstations.
Energy asset monitoring
Energy assets degrade where they are hard to reach, and every inspection costs access time and often lost generation. We inspect composite wind blades for erosion, disbonds, cracking and lightning damage by hand, scanner and drone; survey photovoltaic arrays for hot spots, failed cells and bypass-diode faults, mapped to individual modules; define monitoring strategies for submerged tidal generators; and assess pipeline wall loss with ultrasonic methods at locations chosen by screening. Thermography is fast but near-surface and weather-dependent; ultrasonic and eddy current methods give depth at a point but need access and coupling; drones limit payload and stand-off distance. A fast screen directs slower, more precise checks. You receive located, classified findings, condition maps, repair prioritisation lists, a monitoring strategy with sensor placement drawings and raw data. Equipment: infrared cameras; ultrasonic and eddy current equipment; instrumentation and data acquisition.
How we assure the result
Monitoring is only as good as the data behind it. Often existing sensors and records already hold the evidence, and the work is in cleaning, aligning and interpreting data the operator already collects. Campaigns are planned around operations: which units, which conditions, how many repeats. Wireless links are used only where cabling would disturb the asset, and are checked for latency and lost data. Every job follows the same five checks, and results are reported with their uncertainty, not as single numbers.
- Method review: the measurement plan or approach is matched to the question, the failure modes, the data available and the access.
- Calibration: sensors and acquisition chains are calibrated before and, where practical, after a campaign; cameras and probes are checked against reference blocks and known temperatures; model parameters are calibrated against reference data.
- Verification against known cases: channels are checked against reference conditions on site, models are tested on recorded or seeded faults withheld from training, and findings are compared with reference defects or confirmed repairs.
- Review rounds: data quality and processing, thresholds, false alarms, missed detections and the classification of indications are checked in multiple rounds before anything is reported.
- Traceable records: raw data, calibration records, data and model versions and decision rules are recorded together, and every finding is linked to location, image, conditions and operator.